By Gary Johnson ’05
Modelling the flows of ecosystem services from landscapes to people could help make land use management decisions more informed…and more beneficial.
We all understand on some level that we receive benefits from nature, from the air that we breathe to the food on our table. But have you ever tried to list them all, to quantify them, or even to trace them back to the specific parcels of land where they originated? If you could somehow uncover all of these hidden connections between people and their local environments, you could fundamentally alter the ways in which we interact with and manage our landscapes, both for greater sustainability and for improved quality of life. The field of ecosystem service assessment and valuation tackles this very problem by cataloging services that different landscapes can provide and assigning values to them based on their contexts.
Some of these “ecosystem services” are fairly straightforward for us to imagine. Consider the provision of food, fuel and fiber by agricultural land or the production of lumber by forests. In both cases, a piece of land gives rise to something tangible and valuable to humans through natural processes. These products can be used directly by the landowners or sold on the market, and in either case their value is theoretically captured by this landowner.
However, when we think of landscapes in monetary terms, based solely on the marketable value of their products (e.g., wood, fruits, roots, leaves, plant fibers), we inevitably overlook the functions that they can provide as intact ecosystems. In other words, we need to ask the question, “What valuable services does a forest provide as a forest rather than as a supply of lumber?”
These are a few of the answers: filtering carbon dioxide from the air, mitigating the effects of global warming on climate change; producing oxygen that allows us to breathe; keeping soil and nutrients like phosphorous from eroding into our waterways; providing habitat for animals, plants, fungi and countless microorganisms that we might also benefit from; presenting us with numerous recreational opportunities; and improving the views (and market values) of nearby properties, both public and private.
So what, then, is the value of a forest? Perhaps we could estimate this number by adding up the worth of each of these individual contributions to our welfare. However, questions of worth are really questions about the perceptions and values of people, which are subjective and vary quite a bit across space, time, culture and educational level. Thus, it is very important when making statements about ecosystem service values that we avoid saying “this service has value X” and instead say “this service has value X to these people in this context.”
In that spirit, researchers have been conducting surveys all around the world for the past several decades, asking people how much they value the services of nature. Unfortunately, these studies are both expensive and time-consuming, limiting the number of samples that can realistically be collected. At the same time, the past decade has seen institutions around the world, from natural resource agencies to development corporations, coming to realize the decision-making power of this information.
This brings us to the realm of computer modelling, where I have made my contributions to the field. To our benefit, we now have lots of geospatial data (i.e., maps) regarding not only where the forests, fields, rivers and lakes are, but also where the towns, roads, farms and community centers are. Computer models enable us to link all of this information together and finally tease out the biophysical connections between people and the specific landscapes that provide them services.
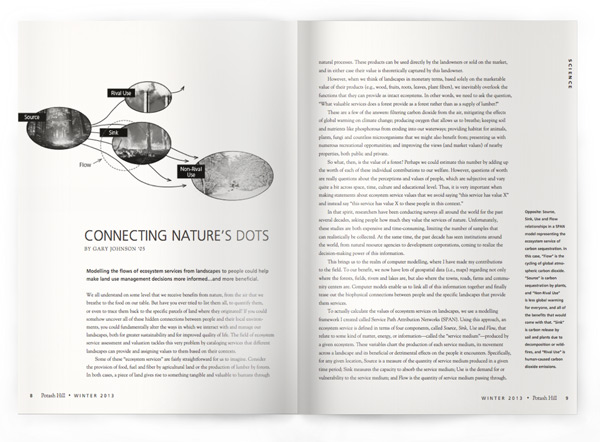
To actually calculate the values of ecosystem services on landscapes, we use a modelling framework I created called Service Path Attribution Networks (SPAN). Using this approach, an ecosystem service is defined in terms of four components, called Source, Sink, Use and Flow, that relate to some kind of matter, energy, or information—called the “service medium”—produced by a given ecosystem. These variables chart the production of each service medium, its movement across a landscape and its beneficial or detrimental effects on the people it encounters. Specifically, for any given location, Source is a measure of the quantity of service medium produced in a given time period; Sink measures the capacity to absorb the service medium; Use is the demand for or vulnerability to the service medium; and Flow is the quantity of service medium passing through.
 At the beginning of a SPAN model, each location on a map is assigned a Source, Sink and Use value based on data from that location. This tells us which areas are capable either of providing a service or of benefiting from one. However, this does not tell us whether any services are actually delivered. To determine this, we simulate the movement of the chosen service medium—such as water for irrigation or flooding, soil for erosion control or sediment deposition, or bees and other insects for pollination—from their Source location to Use locations (i.e., you and me). Along the way, the service medium may be captured by Sinks, possibly reducing the overall amount reaching any Use destination. Think of it as a computer game for water, bees and other environmental benefits.
Once our simulation is complete, we can represent the relationships between Sources, Sinks and Users graphically as a map of flow values. Locations on the map are connected by lines indicating the amount of service that successfully travels between them, connecting landscapes with human beneficiaries like a giant web. In this map we have a strong tool for analyzing the current value of a service in terms of its impacts on specific user groups.
To illustrate these abstract ideas with a concrete example, let us imagine using the SPAN framework to model an ecosystem service we are all very familiar with: scenic views. In this case, the service medium is light traveling from scenic landscape features (Sources)—for example, mountains, rivers, lakes or wetlands—to the eyes of people (Users). As they acquire more unobstructed views of the Source locations, these people experience an increase in their property values and other more subtle benefits. However, in addition to the scenic features, these same people may also see unsightly features (Sinks) such as industrial development, billboards and highways, which reduce the value of any view that passes through them. Our Flow simulation calculates all the visible Sources and Sinks to each User given the local topography (i.e., elevation data) and estimates the value to each user based on their mix of these views.
These same methods are being used to simulate the flow of water and flood mitigation, carbon dioxide and carbon sequestration, crops and food resources and many other benefits of nature in a variety of social contexts. By applying various computer modelling techniques to the problem of ecosystem service assessment and valuation, we can start to map out the connections within any given region between the particular landscapes that provide services and the people who receive them. One of the great strengths of the SPAN framework is that it provides a common definition and representation for the myriad ecosystem services that people are currently trying to model. This allows us to generate maps combining many different services that can be directly compared and analyzed.
Now armed with knowledge of these connections, decision-makers can actually take into account the effect on specific human groups of different land management or climate change scenarios. Being able to broadly identify who is likely to win and lose makes it possible to bring the people who will have the most at stake into decision-making discussions.
Our hope is that by bringing more of the spatially relevant details about ecosystem services into land use management decisions we can begin to support more holistic development or conservation plans. These plans will account for service sources, sink regions and the flow corridors crucial to the transmission of these benefits to human users. As this work is applied by government agencies and businesses, we stand to chart a better, more informed course for our future and that of our environment.
Gary W. Johnson Jr. graduated from Marlboro with a Plan in computer science and geoinformatics, and is currently a doctoral student in computer science at the University of Vermont. Last summer Gary received an award for “Best Student Paper” at the International Congress on Environmental Modelling and Software in Leipzig, Germany, for his paper entitled “Modelling Ecosystem Service Flows under Uncertainty with Stochastic SPAN.”
New Meaning for Computer Language
 “Machine translation was a dream of computational linguists for centuries, and within the last few decades it has become a reality,” said Elias Zeidan, who did a Plan of Concentration in computer science and linguistics. He compared web-based translators using a variety of metrics and found they were not yet viable alternatives to human translation. Elias also used statistics to analyze the Voynich manuscript, a mysterious, 15th-century book written in an unknown alphabet, looking for patterns or clues to the language. “Some of the glyphs look like the Latin alphabet, others look like Arabic numerals, and still others bear no resemblance to any known writing system. Based on statistical properties of natural language, I conjecture that the writing is a language—Middle German? Czech?—enciphered into this writing system.”
